Understanding Multi-Timeframe Analysis in Crypto and DeFi Trading
Multi-timeframe analysis is a systematic approach used by traders to evaluate an asset across different chart intervals in order to form a more structured view of market behavior. Instead of relying on a single chart period, traders examine several time horizons to understand how short-term price action aligns with broader trends. In the context of cryptocurrency and decentralized finance (DeFi), where price fluctuations can be rapid and structural shifts frequent, this method provides a framework for interpreting volatility within a wider market structure.
The crypto and DeFi markets operate continuously and are influenced by diverse factors, including on-chain activity, macroeconomic developments, liquidity conditions, and protocol-specific events. Because of this complexity, price movements visible on lower timeframes often represent only a small portion of a broader trend. Multi-timeframe analysis allows traders to differentiate between temporary fluctuations and movements that reflect deeper structural momentum.
What Is Multi-Timeframe Analysis?
Multi-timeframe analysis involves reviewing the same trading pair or asset across two or more chart intervals. These intervals may range from one-minute charts used by short-term traders to monthly charts favored by long-term investors. The core objective is to determine how trends on smaller timeframes correspond to those on larger ones, and whether trade setups align with the dominant market direction.
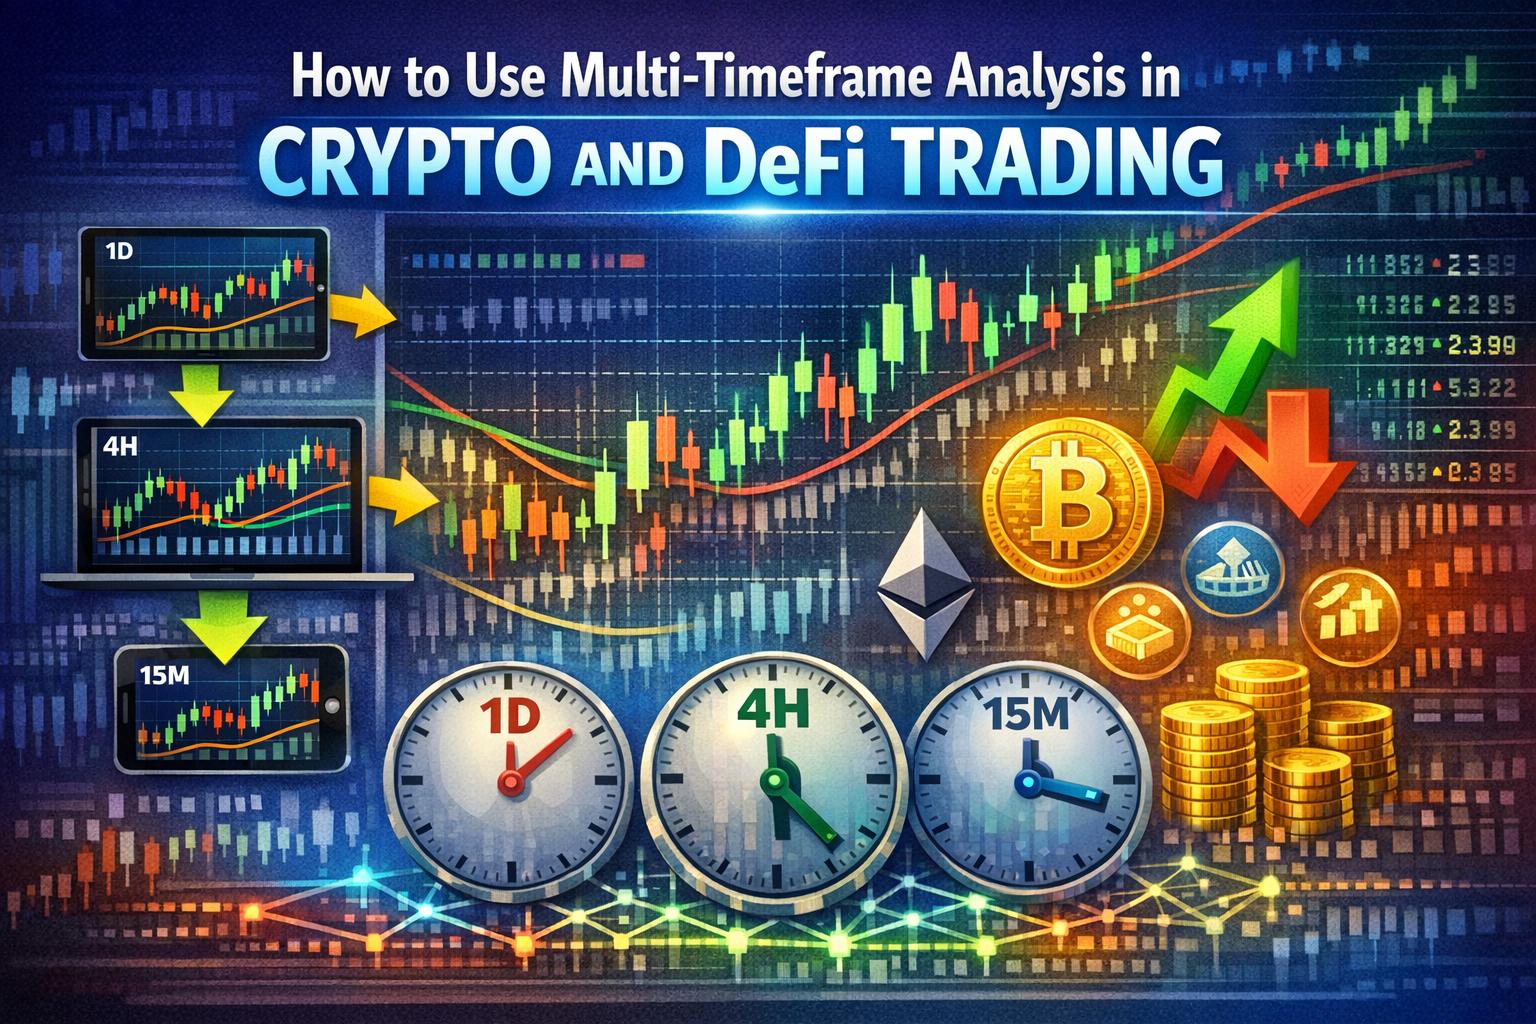
For example, a cryptocurrency such as Bitcoin may appear to be rising strongly on a fifteen-minute chart, while the daily chart shows persistent downward pressure. A trader who observes only the short-term chart may interpret the move as the beginning of a sustained rally. However, when examined from a broader perspective, that same movement might represent a temporary retracement within a larger bearish structure. Multi-timeframe analysis is designed to prevent such misinterpretations by placing individual price swings within their appropriate context.
This method does not replace other forms of analysis. Rather, it complements tools such as support and resistance levels, moving averages, volume indicators, and on-chain metrics. The distinguishing feature is its structured layering of perspectives, where each timeframe contributes different information about trend strength, potential reversals, and timing precision.
Key Timeframes in Crypto and DeFi Trading
Timeframes in crypto trading are generally categorized as short-term, medium-term, and long-term, although these distinctions may vary depending on an individual’s trading style.
Short-term timeframes commonly include one-minute, five-minute, and fifteen-minute charts. These intervals are typically used by scalpers and day traders seeking to capitalize on rapid price movements. In highly liquid crypto markets, significant percentage changes can occur within minutes, making short-term charts suitable for those who monitor markets actively and execute multiple trades within a session.
Medium-term timeframes such as the one-hour and four-hour charts are often associated with swing trading. These intervals allow traders to identify trends that develop over several days while filtering out some of the noise present on lower timeframes. In DeFi token markets, where liquidity conditions may vary, medium-term analysis can provide a balance between responsiveness and structural clarity.
Long-term timeframes include daily, weekly, and monthly charts. These are primarily used by position traders and investors who are less concerned with short-term volatility and more focused on broader directional movements. Long-term charts are particularly useful in evaluating macro trends, major accumulation or distribution phases, and long-cycle developments in blockchain ecosystems.
The relationship among these timeframes is central to multi-timeframe analysis. Movements on shorter intervals often unfold within patterns established by longer ones. Recognizing this relationship helps traders align their entries and exits with the dominant market direction.
Why Multi-Timeframe Analysis Matters in Crypto and DeFi
The crypto market exhibits characteristics that make multi-timeframe analysis especially relevant. Continuous trading, high leverage availability on derivatives exchanges, and significant retail participation contribute to rapid price swings. In DeFi markets, governance decisions, liquidity mining incentives, token unlock schedules, and smart contract activity can lead to sudden shifts in price behavior.
A single timeframe rarely captures this complexity. A lower timeframe may highlight volatility triggered by liquidations or short-term speculation, while a higher timeframe reveals whether the asset remains within a sustained upward or downward trend. By observing both, traders gain a more comprehensive understanding of the asset’s current position within its overall cycle.
Trend confirmation is one of the primary benefits. If an asset is trading above its long-term moving average on the daily chart and printing higher highs and higher lows, the prevailing structure can be considered upward. When the four-hour or one-hour chart then forms a pullback into a key support level, that alignment between higher- and lower-timeframe trends may present a more structured trading opportunity than a counter-trend position.
Noise reduction is another important factor. Crypto markets can generate frequent false breakouts on short timeframes due to thin order books or sudden liquidity shifts. Reviewing a higher timeframe can help determine whether such movements represent genuine structural breaks or isolated fluctuations.
Risk management also benefits from multi-timeframe context. Stop-loss placement and position sizing become more precise when traders understand key support and resistance levels from higher charts. A trade initiated on a fifteen-minute chart might use a four-hour structure to determine invalidation points, thereby incorporating broader market information into risk calculations.
Applying Multi-Timeframe Analysis in Practice
Effective application begins with selecting a logical combination of timeframes. Many traders follow a ratio-based approach, where each higher timeframe is approximately four to six times larger than the lower one. For example, a trader might analyze the daily chart for overall trend direction, the four-hour chart for intermediate structure, and the one-hour chart for entry timing. This layered progression ensures that each timeframe serves a distinct analytical function.
Starting with the Higher Timeframe
The analytical process commonly begins with the highest relevant timeframe. This chart establishes the macro context, identifying whether the asset is trending upward, trending downward, or consolidating. Structural elements such as major support and resistance zones, long-term trendlines, and significant moving averages are best identified at this stage.
In the case of DeFi governance tokens, the daily or weekly chart may reveal long accumulation ranges following token emissions or protocol expansions. Breakouts from these ranges often define medium-term opportunities. Without this perspective, shorter-term movements may be misinterpreted.
Moving to the Intermediate Timeframe
After determining the broader trend, traders typically shift to a medium timeframe to observe how current price action interacts with the macro structure. On this chart, retracements, continuation patterns, and consolidation zones become more visible. It often serves as a bridge between strategic positioning and tactical execution.
For example, if the daily chart shows a sustained upward trajectory in Ethereum, the four-hour chart may reveal whether the asset is undergoing a controlled pullback or losing structural support. This intermediate view refines directional bias before specific entry decisions are made.
Refining Entries on Lower Timeframes
The final step involves analyzing a lower timeframe to identify precise entry and exit points. Traders examine candlestick formations, short-term support and resistance levels, momentum indicators, and order flow patterns. Because lower timeframes react faster to market changes, they allow for tighter stop placement and more defined trade management.
However, the lower timeframe should not contradict the higher one without careful justification. A short-lived breakout on a five-minute chart that conflicts with a clear downtrend on the daily chart requires additional confirmation before acting. Alignment across timeframes strengthens the reliability of a trade setup.
Integrating Technical Indicators Across Timeframes
Indicators such as moving averages, relative strength index (RSI), and volume metrics can be applied on multiple charts to reinforce analysis. When indicators produce consistent signals across timeframes, the probability of a sustained move may increase.
For instance, if the daily RSI shows bullish momentum above a neutral threshold while the four-hour RSI resets to a lower reading during a pullback, the alignment may suggest a continuation scenario. Similarly, moving average crossovers on lower charts may carry more weight when the higher timeframe trend supports the same direction.
Volume analysis also benefits from multi-timeframe assessment. A breakout on a small timeframe accompanied by declining volume on the daily chart may indicate limited participation. Conversely, expanding higher-timeframe volume can confirm genuine structural shifts.
Application in DeFi-Specific Contexts
DeFi markets introduce additional considerations beyond traditional crypto trading. Token emissions, staking incentives, governance voting cycles, and liquidity provisioning dynamics can influence price behavior differently across time horizons.
For example, a new yield farming program may cause a short-term surge in token demand visible on hourly charts. However, if the daily chart reveals that the token remains within a longer-term descending channel and token unlock events are approaching, the sustainability of the rally may be limited. Multi-timeframe analysis helps reconcile these apparently conflicting signals.
Similarly, on-chain data trends often manifest on higher timeframes before impacting shorter-term price charts. Growth in active addresses, total value locked (TVL), or network transactions may gradually influence weekly structures even if intraday volatility obscures the trend. Traders who integrate these observations into a multi-timeframe framework can better contextualize short-term movements.
Common Challenges
While multi-timeframe analysis provides structure, it is not without limitations. Conflicting signals between charts are common, particularly in range-bound markets. A higher timeframe may indicate consolidation, while a lower timeframe cycles between short-lived bullish and bearish patterns. Determining which signal to prioritize requires consistency in methodology.
Another challenge lies in overcomplication. Analyzing too many timeframes can lead to indecision. Effective use depends on selecting a limited set of intervals, assigning each a clear role, and following a predefined analytical sequence. Without such discipline, traders may selectively interpret signals that reinforce preconceived biases.
Crypto market volatility also means that structural shifts can occur rapidly. News events, regulatory announcements, or smart contract vulnerabilities may invalidate technical structures across timeframes. While multi-timeframe analysis enhances contextual awareness, it does not eliminate market risk.
Risk Management and Strategic Consistency
Multi-timeframe analysis functions most effectively when integrated with strict risk management. Position sizing should reflect the distance between entry and invalidation points derived from higher-timeframe structures. Trades aligned with the primary trend may justify different risk parameters than counter-trend setups.
Consistency in execution is essential. Traders benefit from documenting how different timeframe alignments influence outcomes, refining their approach over time. In crypto and DeFi markets, where participation spans global time zones and liquidity conditions can shift quickly, disciplined application of a structured framework improves analytical clarity.
Conclusion
Multi-timeframe analysis provides a systematic method for understanding price behavior in cryptocurrency and DeFi markets. By examining assets across short, medium, and long-term charts, traders can align entry decisions with broader structural trends. This layered perspective enhances trend confirmation, refines timing, and contributes to more precise risk management.
In markets characterized by continuous trading and structural innovation, observing a single timeframe rarely offers sufficient context. A structured multi-timeframe approach does not guarantee accuracy, but it establishes a coherent framework through which volatility can be interpreted. When applied consistently alongside technical tools and sound risk practices, it becomes an integral component of disciplined crypto and DeFi trading.